From Seriously CONFused to Serious CONFerence
At the start of my sophomore year, I was rooted in humanities and had never imagined myself handling data. But after an unexpected class where I used statistical software to analyze gun violence, I realized that empirical research could tell stories too. Around that time, I joined Professor Gary Shaw’s Travelers Lab, where I was tasked with managing sprawling medieval itinerary datasets—thousands of entries tracking the movements of bishops and mobility across 13th- to 16th-century England.
Each spreadsheet contained variables like place names, counties, dates, and coordinates. The lab traditionally used Geographic Information Systems (GIS) for spatial analysis, but I quickly ran into the program’s limitations: static visuals, cumbersome interfaces, and difficulty integrating statistical insights.
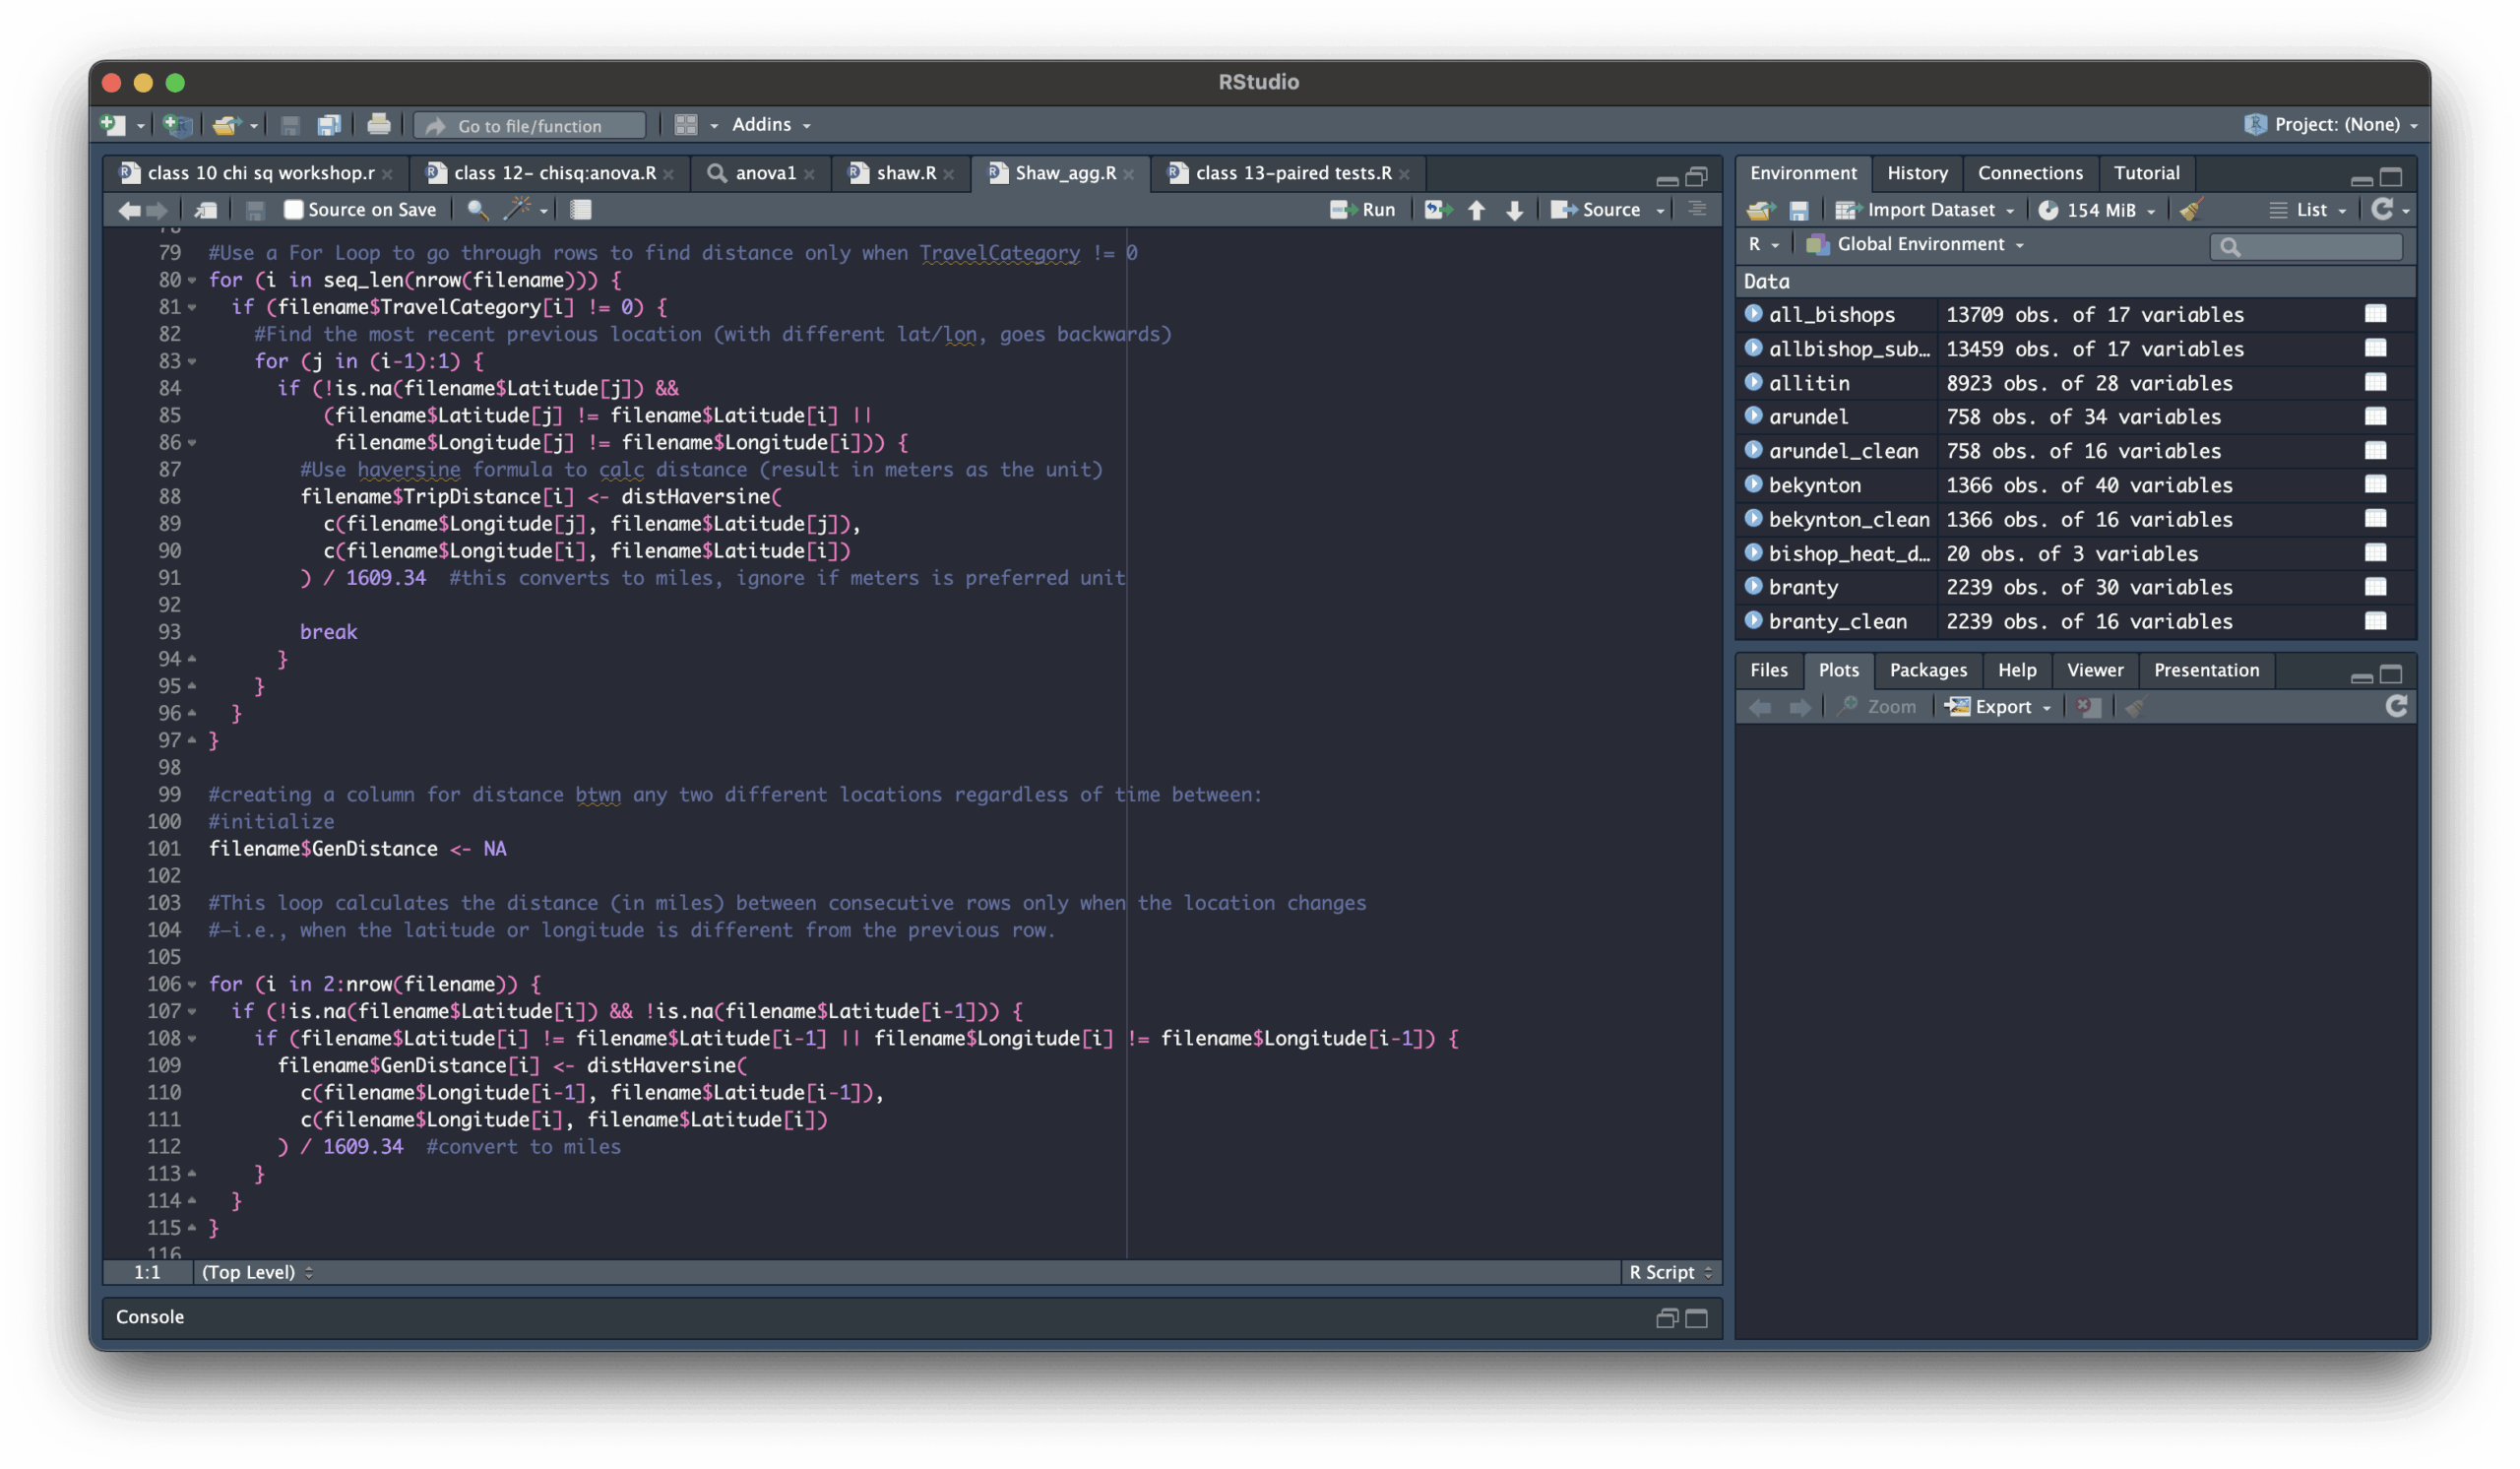
After experimenting independently, I realized that the statistical software R could accomplish everything GIS could, and more. It could clean and transform messy historical datasets with the “tideyverse” package, model mobility patterns, and produce dynamic visuals with far more flexibility. The only problem was that Professor Shaw wasn’t particularly enthusiastic about R; GIS was the lab’s established standard.
So, I made my case. I demonstrated early prototypes, showed how R’s mapping packages (like ggplot2 and sf) could reproduce our itineraries with greater precision, and explained how statistical testing could enrich spatial storytelling. It took persuasion and persistence, but eventually, Shaw agreed to let me pursue this hybrid approach.
The learning curve was steep. I taught myself how to wrangle historical coordinate data, merge text-heavy archival material with quantitative analysis, and write reproducible code. In the process, I developed fluency in data cleaning, visualization, and model interpretation—skills I’d never imagined using in a history lab.
Months later, Professor Shaw and I presented at the New England Historical Association’s annual conference, showcasing my R-based methodology. What began as a self-taught workaround evolved into a research contribution that reshaped how our lab visualized movement in England.