Mapping Violence, Building Connection
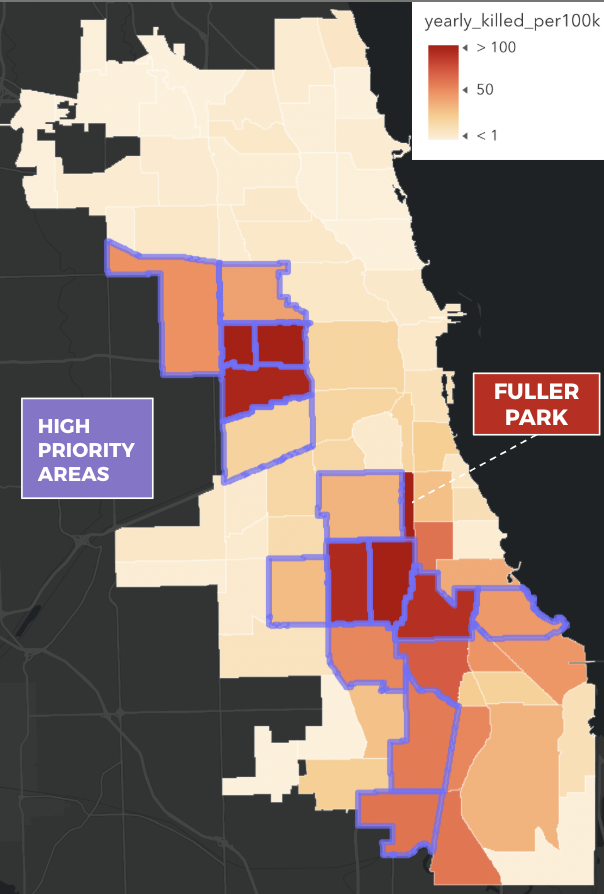
I was one of two sophomores in the class and when the option to work with a partner for the semester-long project on gun violence was announced, I locked eyes with the only other sophomore. After a casual conversation before the next class, our partnership was solidified and the balances were distributed: he was more experienced in quantitative analysis, while I had a deep interest in historical narratives embedded in geography. I only had one stipulation: the project had to be about my hometown and favorite city, Chicago. He agreed. We decided to combine our skills and perspectives, asking how the long-standing sociological framework of the city’s 77 Community Areas might obscure or reveal patterns in contemporary gun violence.
From the start, the work was highly collaborative and experimental. We often met late into the night, trouble shooting code, debating interpretations, and finding ways to visualize the data that felt both rigorous and humane. We began by pulling more than 29,000 incidents of gun violence in Chicago from the Gun Violence Archive, covering 2014-2024. Using R, we cleaned and filtered the data, geocoded missing coordinates through the HERE API, and merged it with Chicago’s community area shapefiles and census data from the City’s data portal.
While I worked on spatially joining the gun violence data with historical variables including datasets on schools, parks, and municipal initiatives, he took the lead on creating maps and hypothesis testing using both logistical and linear regression analyses. We developed our own methodology for layering incidents of gun violence with indicators of disinvestment, using spatial analysis to contextualize present-day data within Chicago’s entrenched inequalities.
What emerged, beyond datasets and final papers, was a mutual understanding that our friendship could make data analysis a profoundly human practice. All of the late nights paid off and our project ultimately led us to present at several conferences, where we shared our findings and workflow with scholars in the field as well as other students.